

Tennessee State
Last 15 games
2-13 in the last 15 · 12.7 scored · 29.5 allowed vs  Western Illinois
 vs Tennessee State
 vs Tennessee State
 vs Tennessee State vs
 Lindenwood
 vs Tennessee State
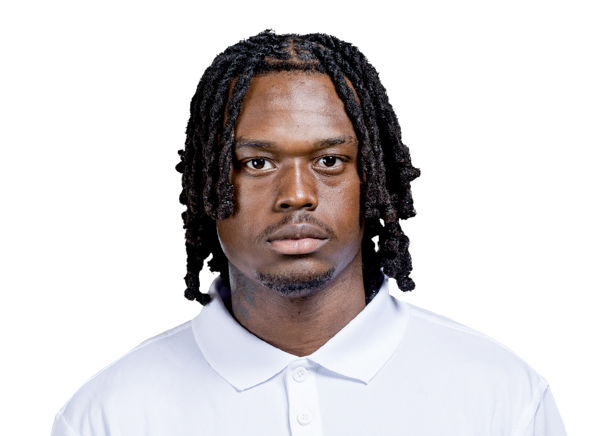
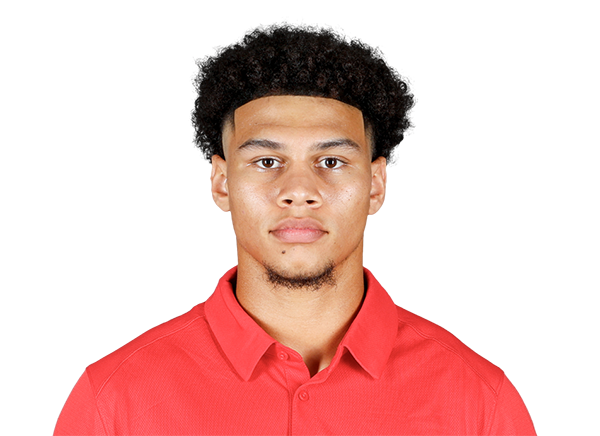
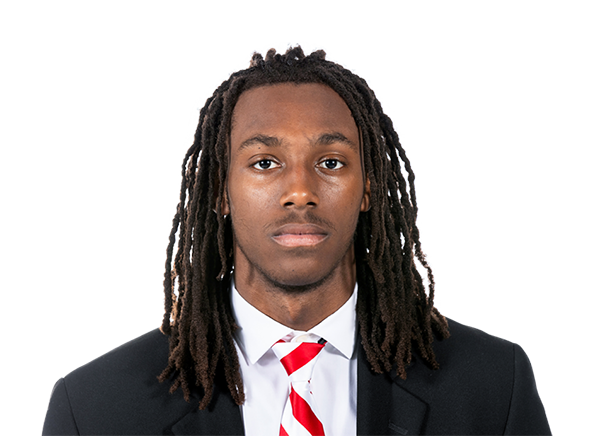
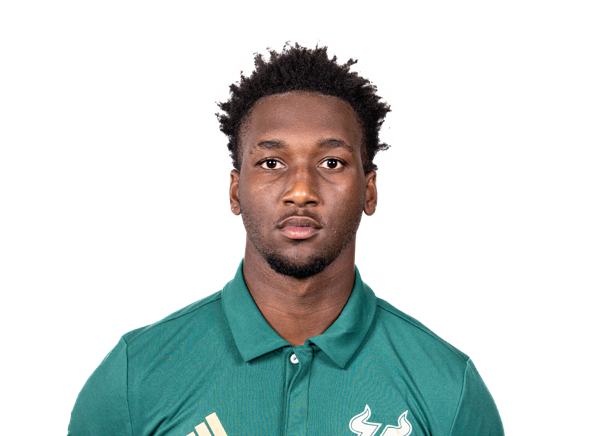 Marcelis TateQB10Byron McNairQB11Daylin LeeQB13Justin PattonQB19Paul JonesQB6Zach Simmons-BrownRB
Offense
49 players

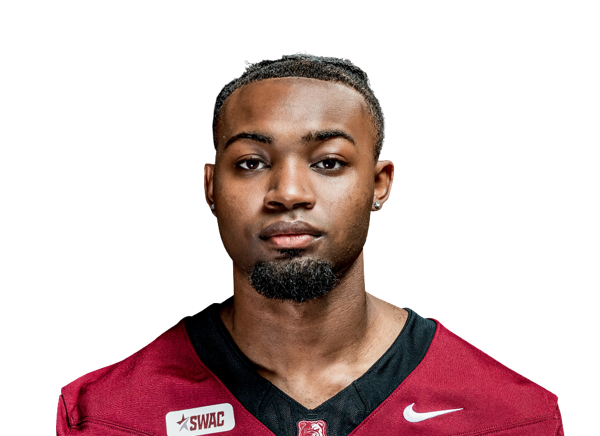
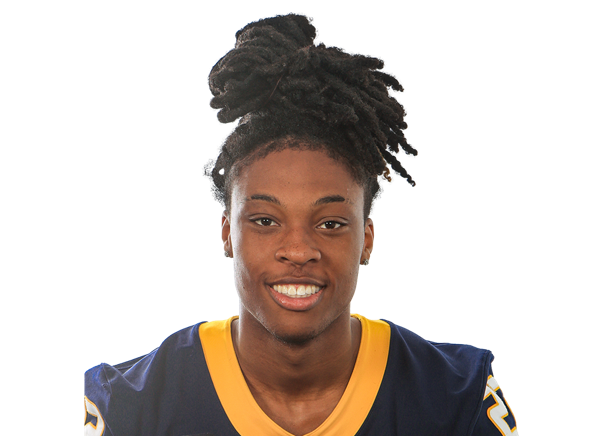
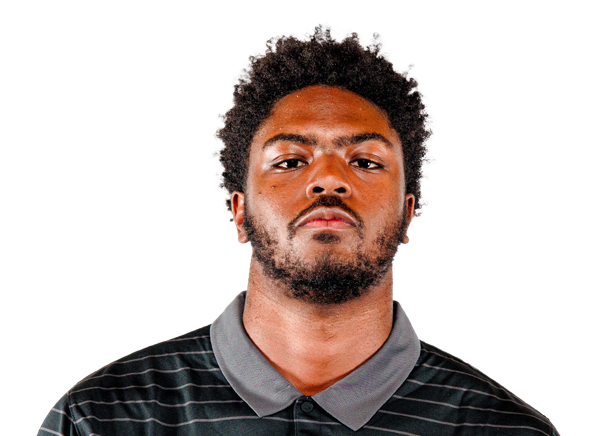
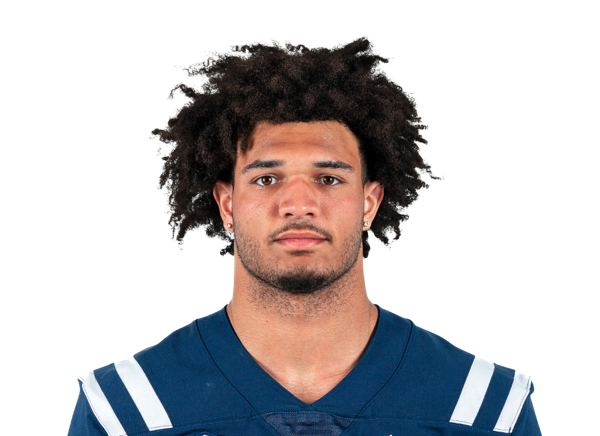
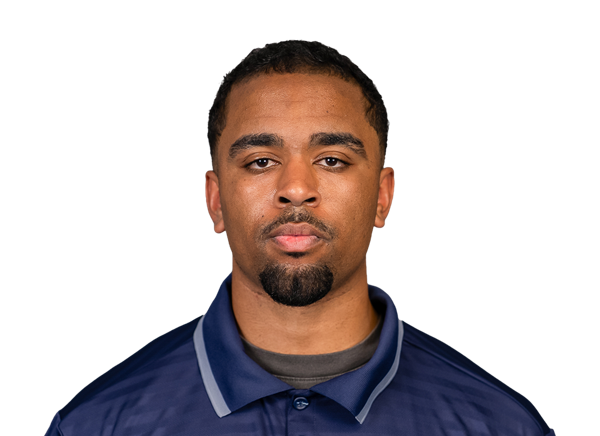
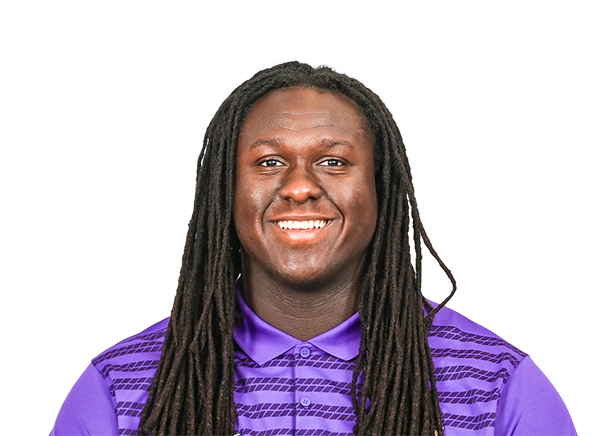
Defense
47 players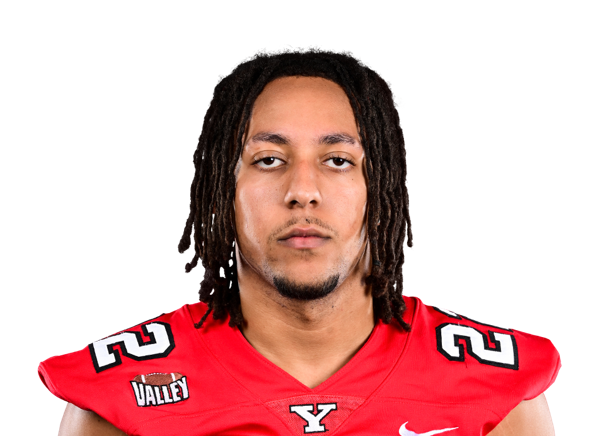
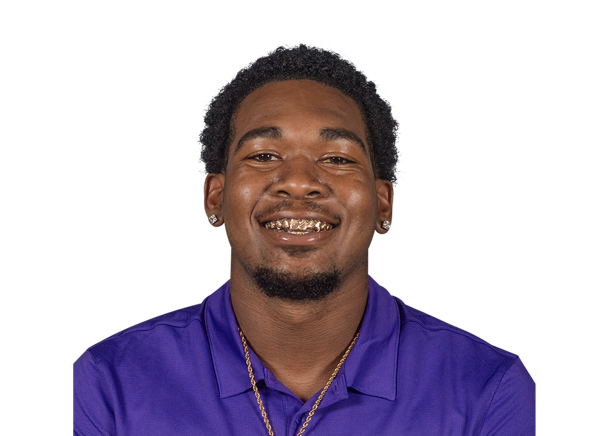
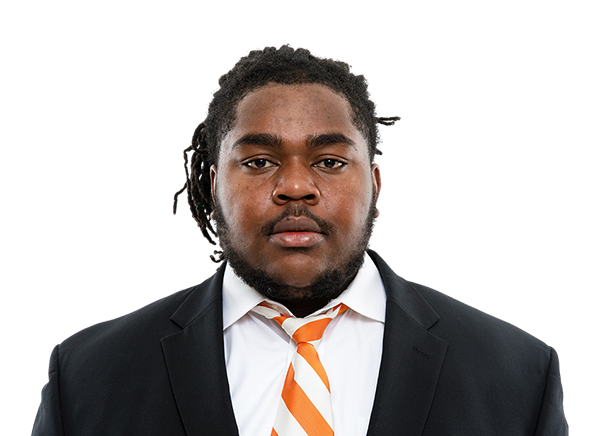
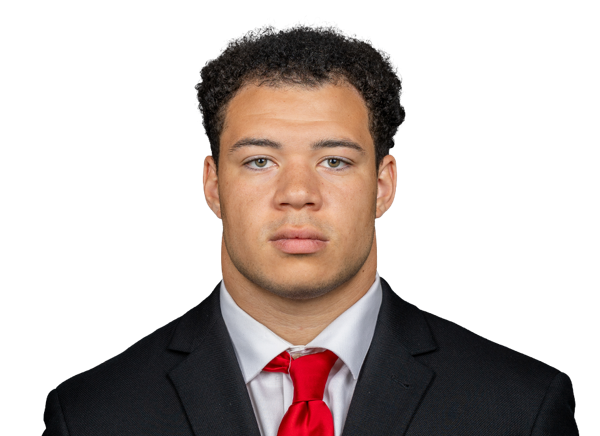
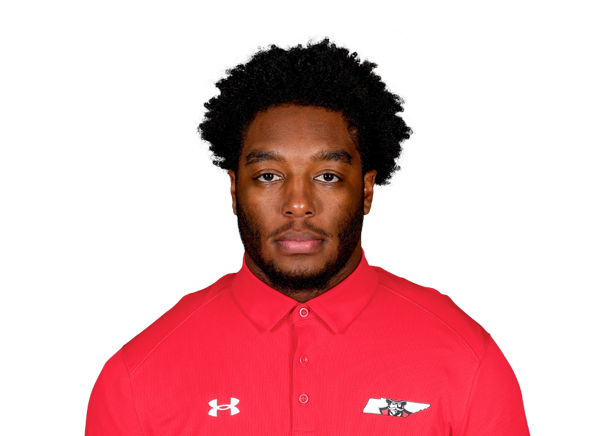
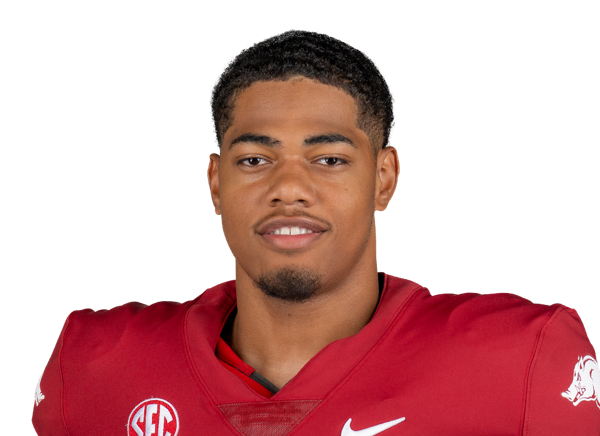

Special teams
7 players| No | Player | Pos |
|---|---|---|
| 42 |  Britton Watts | PK |
| 46 | Preston Hurless | PK |
| 41 | Davion Moore | P |
| 47 |  Truette Tumey | P |
| 43 | Trey Letson | LS |
| 48 | Jaydon Vester | LS |
| Richard Dent | Not listed |
Rosters from CollegeFootballData, by season. Pick a year above.
Depth chart
Tennessee State's published two-deep, week 8: starters and backups at every position, in the school's own position labels. Source: the school's published depth chart. Full depth chart page
Offense
11 positions| Pos | 1st | 2nd |
|---|---|---|
| QB | 11Daylin Lee | 10Byron McNair |
| RB | 29Jeremiah Treadway | 15Brenton Paul |
| WR | 0Jayden Guy | 14Andre Craig |
| WR | 1Cam Bullock | 4Dylan Rodd |
| WR | 9Brock Montgomery | 84Germani Wilson |
| TE | 87Francisco Pratts III | 8Aaron Duncan II |
| LT | 53Steven Nelson | 56Christopher Barnett |
| LG | 51Larodney McQueen | 55Breon Brown |
| C | 52Kennedy Jackson | 58Carlos Pardo |
| RG | 77Lookman Balogun | 54Conner Speller |
| RT | 73Joel Van-Tagoe | 71Jackson Howell |
Defense
11 positions| Pos | 1st | 2nd |
|---|---|---|
| DE | 5Brandon Collins | 31Terence Carpenter II |
| DT | 2Vertonio Weatherton | 4Marlon Huff |
| N | 13Jalen LaBranche | 9Tyree Begne |
| NT | 0Bryce Gray | 50Joshua Green |
| LB | 12DeShawn Carter | 11Matthew Wilson |
| LB | 25Sammy Taylor | 18Jaylon Price |
| LB | 33Epoki Fakaosi | 40Javen Edminston |
| DB | 14Rymen Mosley | 10Syncere Safeeullah |
| DB | 23Byron Davis | 20Jakobe Freeman |
| S | 1Kaiki Baker | 19Joshua Reese |
| S | 8Brendan Hale | 3Mikeece Jones |
Special teams
7 positions| Pos | 1st |
|---|---|
| K | 46Preston Hurless |
| P | 47Truette Tumey |
| LS | 43Trey Letson |
| H | 47Truette Tumey |
| KR | 17Jaden Jones |
| PR | 17Jaden Jones |
| GAME | 8Vs Tennessee State |
Recent results
29 : 26 Florida A&M 3 : 30
 Alabama A&M 3 : 63
 Georgia
 26 : 24 Tennessee State 6 : 7 Charleston Southern
 30 : 14 Tennessee State 35 : 13 Tennessee State 17 : 16 Tennessee State
 7 : 24 Tennessee State 7 : 31
 Eastern Illinois
The latest 12 games. Every season: Tennessee State record by year.
Upcoming
vs Western Illinois vs Tennessee State vs Tennessee State vs Lindenwood vs Tennessee State vs Gardner-Webb Season by season
| Season | Record | PPG | PA | Finish |
|---|---|---|---|---|
| 2026 | 1-3 | 14.8 | 36.3 | Partial record |
| 2025 | 2-10 | 12.9 | 26.6 | Partial record |
| 2024 | 9-4 | 26.8 | 24.2 | Partial record |
| 2023 | 6-5 | 22.7 | 24.7 | Partial record |
| 2022 | 4-7 | 18.3 | 24.7 | Partial record |
| 2021 | 5-6 | 19.7 | 26.9 | Partial record |
| 2020 | 2-5 | 18.4 | 30.6 | Partial record |
| 2019 | 3-9 | 26.2 | 34.6 | Partial record |
| 2018 | 4-5 | 29.3 | 32.1 | Partial record |
| 2017 | 6-5 | 24.3 | 19.6 | Partial record |
| 2016 | 7-4 | 32.3 | 30.1 | Partial record |
| 2015 | 4-6 | 24.6 | 28.1 | Partial record |
| 2014 | 6-6 | 27.7 | 22.8 | Partial record |
| 2013 | 3-1 | 23.3 | 8.8 | Partial record |
| 2012 | 8-3 | 28.8 | 22.8 | Partial record |
| 2011 | 5-6 | 30.5 | 32.8 | Partial record |
| 2010 | 3-8 | 20.0 | 23.5 | Partial record |
| 2009 | 4-4 | 16.9 | 18.9 | Partial record |
Who gets the ball: share of plays, 2026 season
The share of Tennessee State's offensive plays on which each player threw the ball, ran it or was targeted. College programs do not publish snap counts; this is the closest public measure.
| Player | Pos | All plays | Pass plays | Run plays | 3rd down |
|---|---|---|---|---|---|
| Daylin Lee | QB | 60.6% | 91.1% | 23.8% | 79.7% |
| Byron McNair | QB | 27.4% | 34.4% | 21.3% | 32.3% |
| Brenton Paul | RB | 19.0% | 5.4% | 37.1% | 6.5% |
| Zack Simmons-Brown | RB | 13.8% | 3.3% | 29.6% | 8.1% |
| Cam Bulluck | WR | 13.7% | 24.9% | 0.0% | 18.7% |
| Jayden Guy | WR | 11.1% | 19.7% | 1.1% | 14.9% |
| Jerimiah Treadaway | RB | 10.7% | 5.1% | 19.4% | 6.3% |
| Travis Pearson | RB | 7.9% | 4.4% | 12.8% | 4.8% |
| Brock Montgomery | WR | 6.3% | 11.3% | 0.0% | 6.6% |
| Dylan Rodd | WR | 6.0% | 10.6% | 0.4% | 8.1% |
| Marcelis Tate | QB | 5.1% | 7.1% | 3.4% | 0.0% |
| Anthony Taylor | WR | 3.9% | 4.8% | 3.1% | 5.3% |
| Francisco Pratts III | TE | 3.0% | 5.5% | 0.0% | 2.4% |
| Daion Gaston | WR | 3.0% | 5.7% | 0.0% | 3.2% |
| Aaron Duncan | TE | 2.6% | 4.8% | 0.0% | 2.4% |
| Jaden Jones | WR | 2.4% | 3.8% | 0.7% | 5.3% |
| Andre Craig Jr. | WR | 1.7% | 3.6% | 0.0% | 0.0% |
Pass plays and run plays: the share of those plays that went through the player. Source: CollegeFootballData via our data hub.
Strength of schedule
Opponents by win total, week by week, with remaining-schedule difficulty
2026 weekly schedule
A · 1 A · 2 A · 3 A · 5 H · 6 H · 7 H · 8 A · 9 H · 10 H · 11 A · 12 Tougher than average Easier than average · number = opponent's win total
Tennessee State 2026 opponents
| Wk | Opponent | Site | Opp wins | Status |
|---|---|---|---|---|
| 1 | Georgia | @ | 12 | Played |
| 2 | Alabama A&M | @ | 2 | Played |
| 3 | Florida A&M | @ | 5 | Played |
| 5 | Western Illinois | @ | 1 | Upcoming |
| 6 | UT Martin | vs | 1 | Upcoming |
| 7 | Morgan State | vs | 0 | Upcoming |
| 8 | Charleston Southern | vs | 1 | Upcoming |
| 9 | Lindenwood | @ | 1 | Upcoming |
| 10 | Southeast Missouri State | vs | 1 | Upcoming |
| 11 | Eastern Illinois | vs | 2 | Upcoming |
| 12 | Gardner-Webb | @ | 3 | Upcoming |
Opponent strength = each opponent's win total in 2025, its last full season (records-based, no betting win totals are used). Schedule and records from CollegeFootballData. See the full conference strength-of-schedule ranking.
The Mountain West Report
One conference, in your inbox every Tuesday.
Standings, the title race and one opinion on the Mountain West. No filler.
Frequently asked questions
What conference is Tennessee State in?
Tennessee State plays in the FBS Independents.
Has Tennessee State ever won a national championship?
No. Tennessee State has not claimed a national championship.